
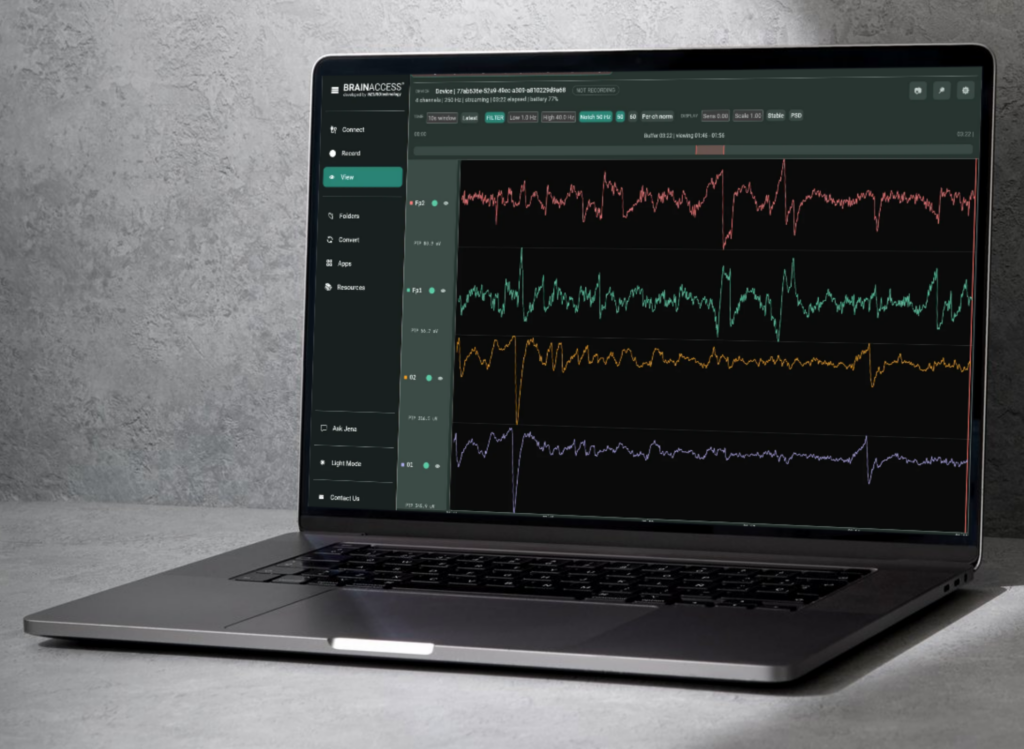
Signal Viewer
Inspect and navigate your EEG data in real time
The Signal Viewer allows you to visually inspect EEG data in real time while streaming or recording. The viewer is fully customizable and can be used to monitor signal quality, apply online visualization filters, clean the signal, send markers, take screenshots, navigate through the recording buffer, and inspect individual channels.
You can also switch between connected devices, hide or show specific channels, adjust the signal display, and open additional views such as the power spectral density plot.
How to launch the Signal Viewer
Launch BrainAccess Board and connect to at least one EEG device or synthetic stream source. After connection is established, there are two ways to launch the Signal Viewer.
Option 1: Open from the sidebar
Click View in the left sidebar.
This opens the Signal Viewer inside the BrainAccess Board interface.
Option 2: Open from the Connected Devices table
Go to the Connected Devices table and click the eye icon under Action.
This opens the Signal Viewer in a detached window or pop-up. This option is useful when working with multiple screens: for example, you can monitor signal quality on one screen while using the main application on another.
Viewing a previously recorded file
If no device is currently connected, you can still stream and view previously collected data.
There are two ways to do this.
Recommended option: Open from the Record page
- Click Record in the sidebar.
- In the left panel, update the Directory field with the folder containing your recording.
- The available files will appear in the right panel.
- Click the 🅅 button next to the file you want to view.
This will open the selected recording in the Signal Viewer.
Alternative option: Open from the View page
- Click View in the sidebar.
- The selected directory will be shown.
- Click Open Recording.
- Select the recording you want to stream and inspect.
General appearance
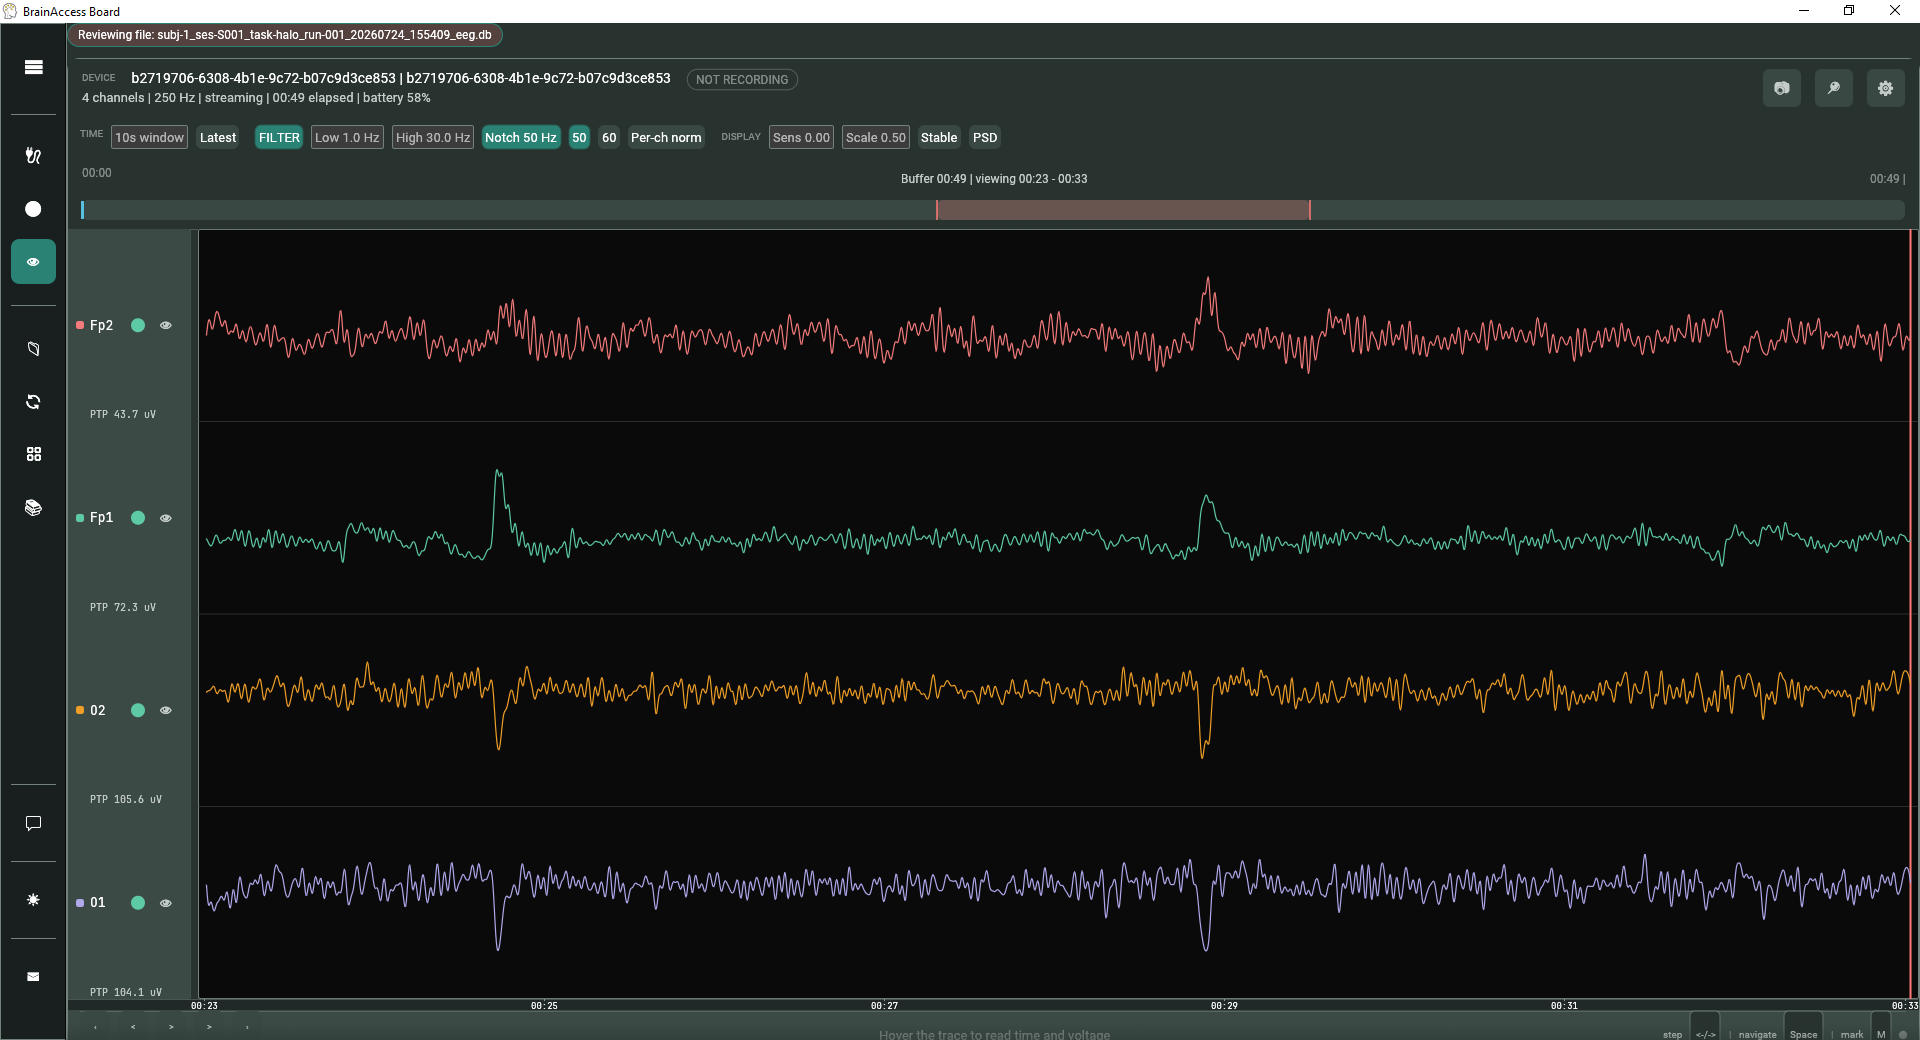
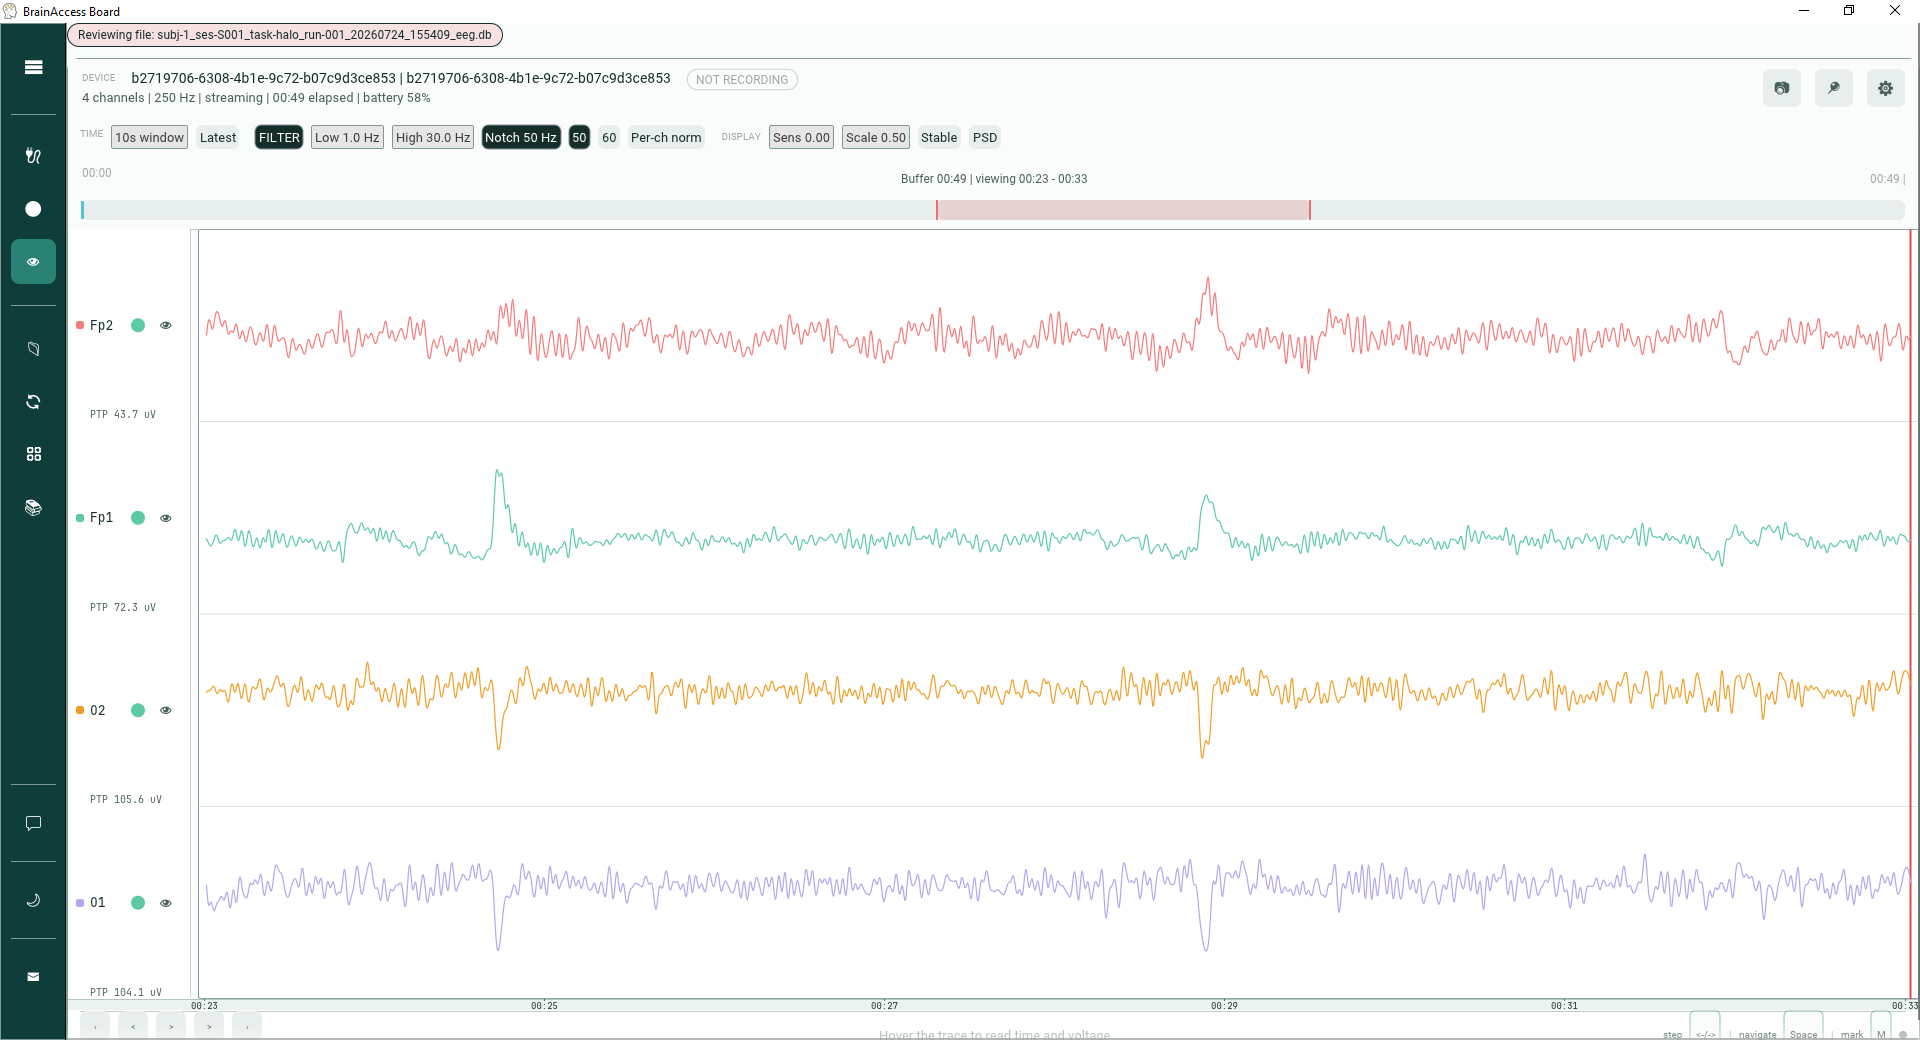
The Signal Viewer displays the EEG signal as a set of horizontal traces, one for each channel.
On the left side of the viewer, each channel has its own control area.
Channel names
Each channel name is shown on the left side of the signal display.
Channels are color-coded. The small colored dot next to the channel name matches the color of the corresponding signal trace.
For example, in the viewer, channels such as Fp2, Fp1, O2, and O1 are displayed with different trace colors.
Data quality indicator
Next to each channel name, there is a data quality indicator.
The indicator uses color to show the current quality of the signal:
- Green: good signal quality
- Orange: noisy signal
- Red: bad signal quality
This helps you quickly identify whether an electrode or channel needs attention.
Show or hide channels
Each channel has an eye icon.
Click the eye icon to show or hide that channel from the display. This is useful when a channel is very noisy or when you only want to focus on specific channels.
Hiding a channel only affects the visualization. It does not remove the channel from the stream or recording.
Signal traces
The main area of the viewer shows the EEG waveform for each channel.
Each trace represents the activity of one channel over the selected time window.
PTP amplitude
For each channel, the viewer shows the PTP value in microvolts.
PTP stands for peak-to-peak amplitude. It indicates the amplitude range of the signal for that channel in the current view.
Navigation bar
At the top of the signal display, there is a horizontal navigation bar.
This bar represents the current recording or streaming buffer. The highlighted section shows which part of the buffer is currently being displayed.
Above the signal area, the viewer also shows information such as:
- current buffer duration
- currently displayed time window
- current position in the recording or stream
You can use this bar to navigate through the available signal buffer when the viewer is not locked to the latest incoming data.
Viewer settings
The top toolbar contains the main customization options for the Signal Viewer.
These options control what you see in the viewer, how the signal is displayed, and which online processing tools are applied for visualization.

Device selection
The DEVICE dropdown shows the connected devices.
Use this dropdown to switch between devices and choose which device signal you want to visualize.
Below the device name, the viewer displays device information such as:
- number of channels
- sampling rate
- current streaming or recording time
- battery status, when available
Time window
The TIME setting controls how much signal is displayed in the viewer.
For example, the default view is usually 10 seconds.
You can increase or decrease the time window depending on whether you want to inspect a shorter or longer segment of data.
Latest
The Latest button controls whether the viewer follows the newest incoming data.
When Latest is selected, the viewer continuously updates and follows the live stream.
When Latest is unselected, the viewer stops following the newest data. You can then scroll backward and inspect previous parts of the signal.
Filter
The Filter button enables or disables online filtering in the viewer.
When filtering is enabled, the displayed data is filtered according to the selected low-pass and high-pass values.
The default setting is usually enabled with a 1–40 Hz band-pass filter.
Use the filter settings next to the Filter button to adjust the low and high cutoff frequencies.
Notch filter
The Notch filter removes line noise from the signal.
You can select either:
- 50 Hz, commonly used in many regions
- 60 Hz, commonly used in other regions
Clean
The Clean option applies online artifact cleaning using wavelet decomposition.
This wavelet algorithm is designed to help clean eye-blink and motion artifacts during visualization.
This is useful for inspecting cleaner signals online while the data is being streamed.
Channel normalization
The viewer allows you to switch between different normalization modes, such as:
- Per-channel normalization
- Common normalization
Per-channel normalization scales each channel independently. This can make it easier to inspect channels with very different amplitudes.
Common normalization applies the same scaling across channels, which can be useful when comparing amplitudes between channels.
Display settings
The DISPLAY settings control the sensitivity and scale of the signal visualization.
You can adjust these settings to make the waveforms appear larger or smaller on the screen.
This is useful when signals are very small, very large, or when you want to optimize the view for visual inspection.
Stable and Flow display modes
The viewer can display the incoming buffer in different modes.
- In Stable mode, the signal display is updated by replacing the viewed segment in a fixed viewer layout.
- In Flow mode, the signal behaves more like a rolling window, continuously moving as new data arrives.
PSD
Click PSD to open a side plot showing the power spectral density for each channel.
The PSD plot allows you to inspect the frequency content of the signal, which can be useful for checking rhythms, noise, and channel quality.
Accelerometer data
If accelerometer data is available for the connected device, a ACC button will appear. Pressing it will display accelerometer data below the EEG channels.
This allows you to inspect motion data together with the EEG signal.
Navigation controls

At the bottom left of the viewer, there are controls for navigating through the signal.
Pause and play
Click Pause to pause the viewer.
Click Play to restart the viewer.
Jump backward and forward
Use the larger arrow buttons to jump backward or forward by the amount of time defined in the TIME setting.
For example, if the time window is set to 10 seconds, the large arrows move backward or forward by 10 seconds.
Use the smaller arrow buttons to move backward or forward in shorter steps, usually around 2 seconds.
Inspecting signal values
At the bottom center of the viewer, you can see the message:
Hover the trace to read time and voltage
Move your cursor over a signal trace to inspect the exact point in the signal.
When hovering over the waveform, the viewer shows:
- the time point in the signal
- the channel name
- the normalized amplitude in µV
This is useful when you want to inspect specific events, artifacts, peaks, or signal changes.
Keyboard controls
The Signal Viewer also supports keyboard shortcuts.
Spacebar: pause latest view
Press Space to toggle the same behavior as the Latest button.
When you press Space, the viewer stops following the newest incoming data. You can then navigate backward and inspect previous parts of the signal.
Press Space again to return to the live view.
Left and right arrows: navigate the signal
After pressing Space, use the left and right arrow keys to move backward and forward through the signal.
Press Space again when you want to return to the live streaming view.
M: send marker
Press M to send a marker.
You can press M multiple times to send multiple markers.
Markers are useful for identifying events during the stream or recording, such as task starts, task ends, participant responses, or observed artifacts.
Configure markers


The Signal Viewer allows you to configure and send markers during streaming or recording.
Markers are annotations saved together with the recording. They are useful for marking specific events, conditions, task phases, participant responses, artifacts, or any other moment you want to identify later during analysis.
To configure markers, click the pin icon in the top-right corner of the viewer.
This opens the Configure Marker window.
Marker configuration fields
Each marker has the following fields:
Type
The marker number. The viewer defaults display from Marker 1 to Marker 4. Press “Add marker” to add another row.
Text
The text that will be annotated in the recording when the marker is sent.
Use this field to describe the event or condition you want to track. For example:
Eyes_openEyes_closedStimulus_onsetButton_pressTask_startArtifact
Key
The keyboard key used to send that marker during streaming or recording.
When you press the assigned key, the corresponding marker is added to the recording.
Auto
Pressing “Auto” shows the default color for the selected marker. When pressing the key, a vertical line will appear with the specific color and the corresponding text. You can customize the color by clicking on it.
Marker 1
Marker 1 is fixed to the M key.
You cannot change the key for Marker 1, but you can change the text that will be annotated in the recording.
For example, Marker 1 can remain assigned to M, but the annotation text can be changed from Marker to something more meaningful, such as Task_start or Event.
Additional markers
Markers 2, 3, and 4 can be assigned to other keyboard keys. Each marker preset has a configurable key (A–Z, 0–9); pressing it sends that marker.
For example:
- Marker 2 →
N - Marker 3 →
B - Marker 4 →
1
After configuring the marker text and keys, you can send markers directly from the keyboard while inspecting the signal.
Press the assigned key each time the corresponding event occurs.
Snapshots

The Signal Viewer allows you to capture the current visible viewer as a PNG image.
This is useful when you want to save a visual example of a specific signal pattern, suspicious artifact, noisy channel, or relevant event during the stream.
To capture a snapshot, click the camera icon in the top-right corner of the viewer.
A snapshot pop-up will appear.
From this window, you can choose where the image will be saved. The snapshot directory can also be changed from the Viewer Settings window, which is the recommended method because it includes a Browse button.
To save the snapshot:
- Click the camera icon in the top-right corner.
- Check or update the save directory.
- Click Capture and save.
A PNG image of the current visible viewer will be saved in the selected folder.
Additional settings


The Signal Viewer includes additional display and application settings.
To open them, click the settings icon in the top-right corner of the viewer.
This opens the Viewer Settings window.
Most of these options are related to the visual appearance of the signal display.
Trace colors
By default, channels are color-coded. Each channel has its own color, and the same color is used for the channel dot and the corresponding signal trace.
In the Viewer Settings window, you can enable Monochrome channels.
When this option is selected, all channels are displayed using a single monochrome trace color:
- black in light mode
- light gray in dark mode
This removes the channel color-coding and can make the viewer look cleaner, especially when many channels are displayed.
Trace line width
The Trace line width setting controls how thick the signal traces appear.
You can increase the line width to make the signal easier to see, or decrease it to make the traces thinner and less visually dense.
This can be useful depending on the number of channels, screen size, and personal preference.
Snapshot folder
The Snapshot section allows you to set the folder where viewer screenshots will be saved.
You can type the folder path directly or click Browse to select a directory.
Reset GUI to defaults
The Reset GUI to defaults button restores the viewer interface to its default settings.
This resets viewer-related settings such as:
- theme
- sidebar state
- active tab
- viewer settings
- filters
- marker presets
- hidden channels
- scope, accelerometer, and PSD layout
- window size and position
Something still unclear? Ask Jena!
Jena is an AI assistant integrated into BrainAccess Board that can help you understand Signal Viewer settings, check device status, evaluate EEG signal quality, and suggest ways to improve your signal in real time.
Open it from Ask Jena in the sidebar and type your question.
For additional information or help troubleshooting, please contact: [email protected]