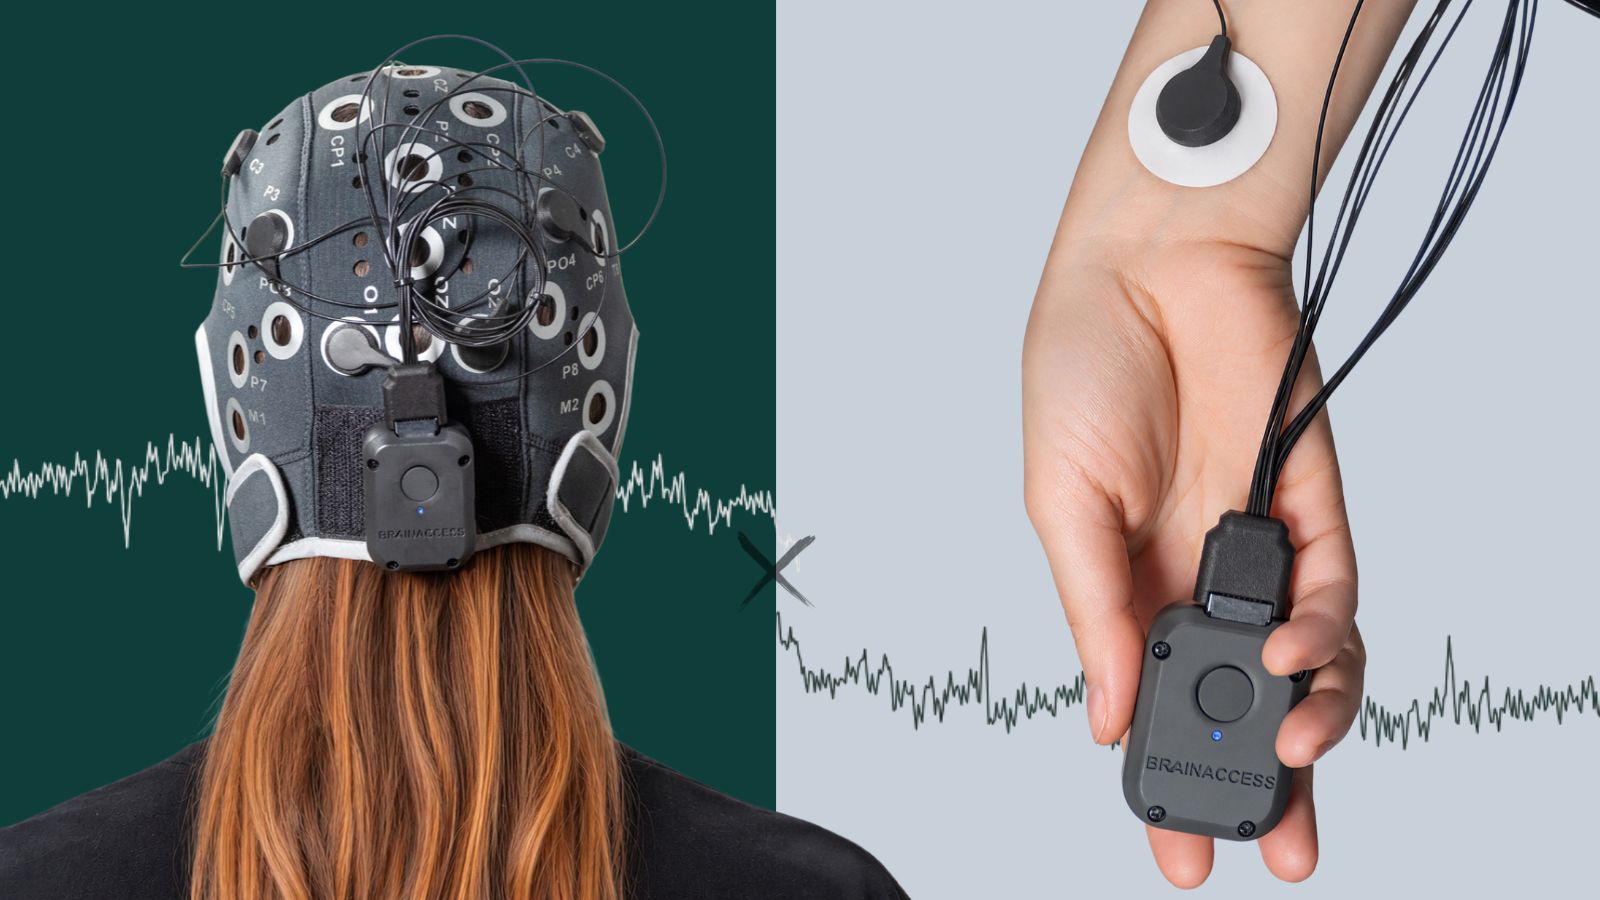

Your heartbeat leaves a mark on your EEG. In this post, we show why recording heart and brain together opens the door to adaptive and biofeedback applications, then walk through a hands-on tutorial with BrainAccess ExG8: from heart-rate variability to heartbeat-locked brain activity in a few lines of Python.
Heart and brain: a two-way conversation
The brain and heart are in constant two-way conversation. The brain adjusts heart rhythm from moment to moment through the autonomic nervous system, and signals from the heart travel back to the brain, shaping its activity and even how we perceive the world [1, 2]. Every heartbeat leaves a measurable trace in the EEG.
Because heart rate, heart rate variability (HRV) and EEG band power can all be computed together and in real time, they make ideal inputs for systems that adapt to the user’s state [3]:
- Biofeedback and relaxation training that tracks breathing-driven HRV and its effect on brain activity [4, 5].
- Stress and focus monitoring that combines cortical and autonomic markers [6, 7].
- Adaptive games and study tools that ease off or adjust when the user’s state changes [3].
In this post, we outline the advantages of measuring the two modalities together and walk through a practical tutorial on how heart activity shows up in EEG data recorded with BrainAccess ExG8.
The full notebook, with data, is available here:
Why record EEG and ECG together?
Combining EEG and ECG features has improved stress classification compared with either signal alone [4].
Both signals can be recorded with portable hardware like BrainAccess, moving stress research into real-world settings.
💡 The brain responds to every heartbeat.
These heartbeat-evoked potentials are studied as a window into interoception, how the brain tracks signals from the body. Measuring them requires separating them from the heart’s own electrical field on the scalp [8].
This is what we look at in the tutorial below.
Tutorial: heart and brain with BrainAccess
We recorded about 6 minutes of EEG with a BrainAccess MINI (Fp1, Fp2, O1, O2, 250 Hz) while an ECG was recorded at the same time with a BrainAccess ExG device. Each heartbeat (R-peak) detected in the ECG was added to the EEG file as an annotation, so both signals share one timeline. The EEG is band-pass filtered at 1–40 Hz.
import mne, numpy as np

raw = mne.io.read_raw_fif('data/mini_heartbeat_raw.fif', preload=True)
beats = np.array([a['onset'] for a in raw.annotations
                  if a['description'] == 'R_peak'])
print(f'{len(beats)} heartbeats')   # 460 heartbeats
The full notebook, with data, is available here:
STEP 1
Heart rate and heart-rate variability
The time between successive beats is the RR interval. From it we get instantaneous heart rate and two standard HRV measures: SDNN (overall variability) and RMSSD (beat-to-beat variability, linked to parasympathetic activity).
rr = np.diff(beats)                                  # seconds
hr = 60 / rr                                         # bpm
sdnn = rr.std(ddof=1) * 1000                         # ms
rmssd = np.sqrt(np.mean(np.diff(rr) ** 2)) * 1000    # ms
STEP 2
EEG locked to the heartbeat
We cut the EEG into short windows from 200 ms before to 600 ms after every heartbeat and average them. Averaging cancels everything that is not time-locked to the heart.
events, event_id = mne.events_from_annotations(raw, event_id={'R_peak': 1})
epochs = mne.Epochs(raw.copy().pick('eeg'), events, event_id,
                    tmin=-0.2, tmax=0.6, baseline=(-0.2, -0.05),
                    reject=dict(eeg=150e-6), preload=True)
epochs.average().plot()                              # 456 of 460 beats kept
Two things stand out:
- A sharp peak at 0 ms. This is the heart’s own electrical field reaching the scalp, the cardiac field artefact. It is not brain activity, but it confirms that the heart and EEG timelines are precisely aligned. It can be removed when only brain activity matters.
- A slower wave around 250 ms. The window 200–600 ms after the beat is where heartbeat-evoked potentials are studied. Drawing conclusions about them takes more beats, careful artefact handling and proper statistics, but the signal is visible even in 6 minutes of data.
STEP 3
Every heartbeat at once
Plotting each beat as one row of colour shows why averaging matters. Single beats at O1 are dominated by ongoing brain activity; the heartbeat-related response only emerges clearly in the average underneath.
mne.viz.plot_epochs_image(epochs, picks=['O1'], sigma=2.)
Two things stand out:
- A sharp peak at 0 ms. This is the heart’s own electrical field reaching the scalp, the cardiac field artefact. It is not brain activity, but it confirms that the heart and EEG timelines are precisely aligned. It can be removed when only brain activity matters.
- A slower wave around 250 ms. The window 200–600 ms after the beat is where heartbeat-evoked potentials are studied. Drawing conclusions about them takes more beats, careful artefact handling and proper statistics, but the signal is visible even in 6 minutes of data.
The full notebook, with data, is available here:
Collect your own data!
If you already have a BrainAccess device, you can immediately stream the data directly with the BrainAccess SDK:
from brainaccess import EEGManager
from brainaccess.utils import EEG

eeg = EEG(mode='roll')                          # keeps the most recent 10 s
with EEGManager() as mgr:
    eeg.setup(mgr, device_name='BA MINI 001')
    eeg.start_acquisition()
    raw = eeg.get_mne(tim=4)                    # last 4 s as mne.io.Raw
    eeg.stop_acquisition()
eeg.close()
Or read live data from all connected devices through BrainAccess Board:
import brainaccess_board as bb

db, ok = bb.db_connect()
raws = db.get_mne(duration=4)                   # last 4 s of every device
Want to record heart and brain together?
BrainAccess ExG8 is coming soon, making synchronized multimodal recordings easier than ever. Stay tuned!

References
[1] Azzalini, D., Rebollo, I., & Tallon-Baudry, C. (2019). Visceral signals shape brain dynamics and cognition. Trends in Cognitive Sciences, 23(6), 488–509. https://doi.org/10.1016/j.tics.2019.03.007
[2] Thayer, J. F., & Lane, R. D. (2009). Claude Bernard and the heart–brain connection: Further elaboration of a model of neurovisceral integration. Neuroscience & Biobehavioral Reviews, 33(2), 81–88. https://doi.org/10.1016/j.neubiorev.2008.08.004
[3] Fairclough, S. H. (2009). Fundamentals of physiological computing. Interacting with Computers, 21(1–2), 133–145. https://doi.org/10.1016/j.intcom.2008.10.011
[4] Lehrer, P. M., & Gevirtz, R. (2014). Heart rate variability biofeedback: How and why does it work? Frontiers in Psychology, 5, 756. https://doi.org/10.3389/fpsyg.2014.00756
[5] Prinsloo, G. E., Rauch, H. G. L., Karpul, D., & Derman, W. E. (2013). The effect of a single session of short duration heart rate variability biofeedback on EEG: A pilot study. Applied Psychophysiology and Biofeedback, 38(1), 45–56. https://doi.org/10.1007/s10484-012-9207-0
[6] Ahn, J. W., Ku, Y., & Kim, H. C. (2019). A novel wearable EEG and ECG recording system for stress assessment. Sensors, 19(9), 1991. https://doi.org/10.3390/s19091991
[7] Attar, E. T., Balasubramanian, V., Subasi, E., & Kaya, M. (2021). Stress analysis based on simultaneous heart rate variability and EEG monitoring. IEEE Journal of Translational Engineering in Health and Medicine, 9, Article 2700607. https://doi.org/10.1109/JTEHM.2021.3106803
[8] Park, H.-D., & Blanke, O. (2019). Heartbeat-evoked cortical responses: Underlying mechanisms, functional roles, and methodological considerations. NeuroImage, 197, 502–511. https://doi.org/10.1016/j.neuroimage.2019.04.081